CNN cited me in their story, “The lottery game that’s bigger than Powerball” by Chris Isidore on February 11, 2015 about the economics of state lotteries.
The odds of winning an instant game are actually better than they are for Powerball and MegaMillions. Scratch-off games typically pay out about 70% of the money spent on tickets. Only about half the money spent on Powerball is distributed to winners.
By comparison, a casino slot machine pays out between 90% and 99% of the amount wagered, according to John Spry, a finance professor at the University of St. Thomas in Minnesota, who studies lotteries
The odds aren’t the only difference between these games — the people who play instant games are typically poorer.
According to a study by Spry, about three out of four instant game tickets are purchased by people with below-average incomes. Wealthier players tend to enter the big multi-million drawings.
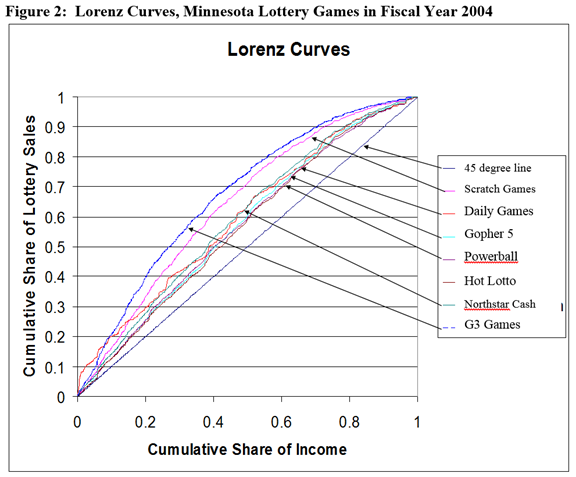
It would be better to say that people that cumulatively have the bottom 50% of income purchase 75% of instant game tickets. Instant, scratch games are more regressive than jackpot games like Powerball or Mega-Millions.
The following figure from my paper 2005 paper “The Relative Regressivity of Seven Minnesota Lottery Games.” (with Kathryn L. Combs and J.B. Kim) in the Proceedings of the National Tax Association Proceedings graphs the cumulative distribution of per capita income versus the cumulative distribution of lottery sales by zip code for seven Minnesota Lottery games. Lottery sales are a large share of income for lower income zip codes than for higher income zip codes.
You can read the entire story here: http://money.cnn.com/2015/02/09/pf/powerball-jackpot-odds/index.html?iid=EL
